Showing posts with label ridership. Show all posts

10 December 2022

Leaping Off the Fiscal Cliff

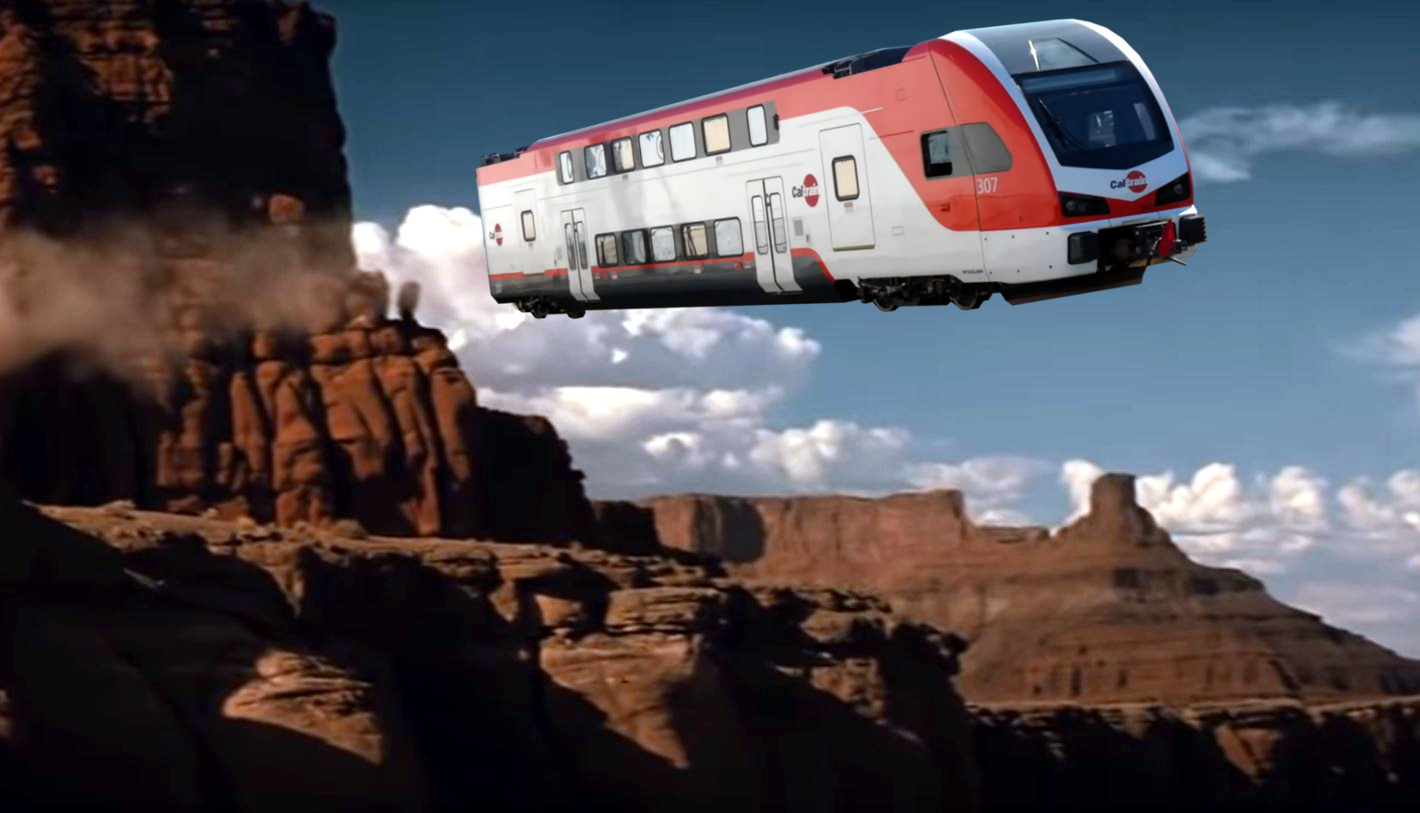
EMU jumping off cliff
One phrase we're going to hear a lot in the next couple of years is "fiscal cliff," a sudden disequilibrium between Caltrain's revenues and expenses caused by the withdrawal of the temporary federal subsidies instituted during the pandemic. The slow recovery of ridership, which until 2019 had funded ~70% of the railroad's operating expenses, is opening a $50 million/year hole in Caltrain's budget outlook through the rest of this decade, according to a draft Short Range Transit Plan (SRTP) recently submitted to the Metropolitan Transportation Commission (MTC).

The SRTP is a process that every four years requires each agency to project hypothetical near-term fiscal scenarios under a standard set of assumptions. Most interesting in Caltrain's draft is that the agency threw in a bonus scenario besides the prescribed hypothetical scenarios: the "Electrified Service scenario" a.k.a. Caltrain's actual plan.

This "Electrified Service scenario" makes zero effort to tackle operating costs, hiding behind a theory that Caltrain is inherently a high-fixed-cost operation, meaning that costs are not highly variable with the level of train service provided. All efforts are instead directed towards securing "funding opportunities," an approach that could very well succeed, as transit funding effectively grows on trees in California, no matter how inefficiently expended. Here are the scary numbers:

What if we blew up some long-held assumptions and attacked this fiscal cliff from the cost side?

Ditch Diesel Now and Go 100% Electric

Since time immemorial, the peninsula corridor electrification project has been sold as only a partial step towards electrification, anticipating that only 75% of the service would become electric with 25% remaining diesel, primarily to serve the non-electrified portion of the corridor south of San Jose. Operating a mixed fleet of diesel and electric trains blows up operating and maintenance costs, since many functions have to be duplicated (training, tools, spare parts, etc.). Revenue miles per vehicle are projected to drop by 10% when electrified service starts, which is a sure sign that your fleet is too big and isn't working hard enough.

How can Caltrain possibly operate with only the 19 EMU sets that will be delivered by 2024?

One certainly can't use all 19 in revenue service. Set one aside for maintenance downtime (grade crossing collisions will continue), and keep another two in reserve for timetable protection, essentially hot spares parked at each end of the line, crewed and ready to enter service at moment's notice to plug any delays during the peaks. That leaves just 16 sets to support a peak service level of six trains per hour per direction, a firm condition of Caltrain's funding agreement with the federal government.

That sounds downright impossible.

However, if you change the goals of a timetable to maximize equipment utilization, it turns out that it can be pulled off. Good service is just a side effect. Here is a new all-electric timetable that makes those shiny EMUs really earn their keep:

All EMU 6 tphpd
Score: 123 (relative to the benchmark score of 100 for the 2011 timetable)
Fleet: 16 EMU (zero diesel)
Utilization: 87% of train-minutes in revenue service

This is admittedly a slightly sporty timetable in that it requires aggressive 10-minute turns and a European level of padding of 7%, less than Caltrain is accustomed to dawdling with. The resulting risk of delay is mitigated by "protect" trains at each end of the line. There is also margin in the long station dwells (45 seconds) and the leisurely acceleration times built into the timetable, with power capped at only 2/3rds of the EMU's nominal rating.

The new EMUs would become highly productive assets by providing about 1.9 million revenue vehicle miles per year using just 133 cars, about 1.5x better utilization of these expensive depreciating capital assets than is currently contemplated.

The savings from disposing of the entire diesel fleet would be significant, and their residual resale value would only help Caltrain's balance sheet. The newer Baby Bullet fleet will have reached 20 years of revenue service, the minimum required by the FTA for federal funding assistance, so no penalties will arise from their early disposal. although its disposal would incur a small penalty reimbursement to the FTA since the equipment will not have reached its 25-year minimum useful life (according to FTA Circular 5010-1E, page IV-26.)

Divest the Gilroy Branch

One hitch: the overhead wire doesn't extend to Gilroy.

Gilroy service is a big weight on Caltrain's operational balance sheet because the ridership and revenue is minuscule compared to the high fixed cost of maintaining diesel service. Before the pandemic, ridership south of San Jose city limits (Blossom Hill) made up a negligible 0.8% of Caltrain's weekday ridership. South of Tamien was hardly better, at 1.2%. Until electrification is extended down to Blossom Hill (as it should be), it makes better sense to transfer this infrequent diesel service to an extended Capitol Corridor, with a direct cross-platform transfer to Caltrain in San Jose.

This can rid Caltrain of the entire diesel fleet, which is currently planned to remain at least 9 locomotives and 79 (!!) cars. It also frees Caltrain from another headache, having to comply with near-term diesel emissions mandates under consideration by the California Air Resources Board.

Reduce Conductor Over-staffing

Caltrain has too many assistant conductors. Assistant conductors are very expensive, costing about $15 million/year by FY25, about 1/3 of the operating deficit. Note this figure does not include conductors, only their assistants. The new EMUs relieve some of their duties, such as announcing station stops. The new fleet also has automatic passenger counters, giving precise real-time insights into passenger loads. While today's conductor staffing levels are determined by a formula from the number of cars, the formula should instead be revised to use recent passenger loads. This would ensure that all trains have a consistent staff/passenger ratio and that conductors have fair work loads.

Change the Operating Culture

With six electric trains per peak hour and at least 20-minute service at all stations, much better than is provided today, the conditions could be created for a robust recovery of ridership. Good service drives ridership, but if Caltrain is allowed to execute their mixed-fleet "Electrified Service scenario," as planned, we will barely achieve any service improvement as costs continue to spiral upwards.

Applying these cost-saving measures, Caltrain could close their operating deficit and erase any "fiscal cliff" without expending any energy to capture ever more "funding opportunities" to support entrenched and inefficient operating practices. The fleet does not need to grow, nor does the headcount. The operating culture needs to change: it's not enough to buy Swiss trains; you need to actually run them like the Swiss.

27 September 2018

Growing Caltrain into an 8-Lane Freeway

Caltrain can and should become an eight-lane freeway. Not like an ugly concrete scar tearing loudly through the landscape, but in terms of throughput capacity in people per hour. Today, Caltrain already carries the equivalent of nearly 3 freeway lanes, and more than doubling the system's capacity is hardly a moonshot. For perspective, BART's Transbay Tube carries up to 27000 people per hour, almost double the entire capacity of the Bay Bridge with its ten freeway lanes.

More than doubling Caltrain's capacity has been proposed before and is now being studied by the agency itself, after a decade of not thinking much past electrification.

Capacity calculations can be controversial and rely on many details and assumptions, so the suggested path to expand Caltrain ridership from 3 to 8 lanes of freeway-equivalent is provided in the form of a spreadsheet, embedded below. You can dig into all the numbers and assumptions for each capacity increase and see the underlying formulas for yourself, down to the detailed number of seats in each train car, to understand how it all adds up.

This is a living document, and feedback is appreciated!

12 August 2017

Freeway Lanes of Caltrain

If everyone drove instead of taking Caltrain, how many more lanes would peninsula freeways need to absorb the additional traffic?

The way to answer this question is to count how many train passengers ride past any given location, in each direction, within the span of one hour. Caltrain publishes all the information you need to do this calculation rigorously, without making any assumptions: the timetable tells you when each train passes each location, and the 2016 weekday passenger count by train tells you how many people are on board that train at that time.

Four cases are considered: morning northbound, evening northbound, morning southbound, and evening southbound. Rather than picking a fixed morning and evening hour over which to count passengers, we slide a one-hour window across the peak period until we find the peak hour at each location, during which the most passengers ride past. Caltrain operates five trains per hour per direction repeating on an hourly cadence, so we never count more than five trains in the totals.

It is an easy but tedious calculation, perfectly suited for a computer.  This is what pops out:


This graph reveals many of the features noted in ridership reports: the flow is asymmetrical with more riders traveling northbound AM / southbound PM, the Gilroy branch is dead, Stanford generates enormous ridership, etc.

Translation to Freeway Lanes

To convert the number of Caltrain passengers into freeway lanes, very few assumptions are needed, and those we need can be backed up by references.
  1. A congested freeway lane operating at 45 mph can carry 2000 passenger cars per hour, according to the Federal Highway Administration's HPMS Field Manual (Parameter values: FFS = 45 mph, BaseCap = 2150 pcphpl, PHF = 0.95, fHV = 0.98, fp = 1.0).
     
  2. The average vehicle occupancy (AVO) is 1.3 people, based on two studies of the 101 corridor in San Mateo County. This figure includes buses, van pools and corporate shuttles.
This means a single freeway lane can theoretically carry 2600 people in one hour. Note this is a very optimistic figure because slight perturbations in the flow of traffic can cause slow-downs that reduce throughput due to lower free flow speed (FFS). But we'll use this very high number to make an extremely conservative estimate of how many lanes of freeway can carry all of Caltrain's ridership.

Freeway lanes typically do not change directions to accommodate peak flows. That means we must consider northbound lanes separately from southbound lanes, with no possibility of re-allocating the lane capacity to accommodate the AM/PM flow asymmetry that is observed on Caltrain. In practice, this means we must add the northbound peak flow (AM or PM, whichever is highest) to the southbound peak flow (again the highest of AM or PM) to size the number of equivalent freeway lanes. Looking at the graph above, which shows the highest flow is northbound AM and southbound PM, we must add AM northbound and PM southbound people per hour, and divide by 2600 people per hour per freeway lane. Here is the result:


So as of 2016, plain old diesel Caltrain equals about 2.5 lanes of freeway, including both directions. If you integrate the area under this curve, you get how many lane-miles of freeway would be needed to replace Caltrain. That number is 119 lane-miles. These are very conservative lower bounds.

When you hear the argument that "millions" of people use highway 101 but only about 30,000 people use Caltrain, shut it down with facts: today Caltrain amounts to 2.5 / 8 or at least 30% of the lane capacity of highway 101 during rush hour. The reply might be that not all those people would end up on 101, but with an average trip length of 23 miles, which driver wouldn't use a freeway?

Future Capacity Implications

Caltrain capacity is set to increase considerably, first by ~30% with the initial electrification and modernization project, and by ~60% once the system is running at 6 trains per hour with 8 cars each. (If you don't count standees, those figures are ~10% and ~25%, but why would you not count standees?) A 60% capacity increase is equivalent to one and a half lanes added to the entire length of highway 101 from San Jose to San Francisco.

It doesn't have to stop there: more trains per hour and longer trains are possible, because EMU trains scale up in a way that diesel can't. A future Caltrain capacity increase to about 10,000 passengers per peak hour per direction (about triple today's throughput) isn't out of the question, does not require adding tracks or expanding the rail corridor, and would equate to adding 5 new freeway lanes.

In certain quarters of Silicon Valley that are enamored of Hyperloops, self-driving Teslas and Boring underground tunnels, electric Caltrain is looked down upon as a last-century technology that is about to be made obsolete. That particular outlook fails to grasp the importance of throughput or to recognize the enormous carrying capacity of modern electric rail. Self-driving Teslas and Hyperloops will achieve dismal throughput capacity as measured in passengers per hour, and no amount of whiz-bang technology will change the underlying geometry of this increasingly urban region.

The way forward is to add more freeway lanes of Caltrain.

10 July 2016

The Capacity Problem

These days, Caltrain is breaking a ridership record nearly every month.  Rush hour trains are running with standing-room-only crush loads, measured by Caltrain's statistics as a percentage of seating capacity.  The most recent ridership counts (tallied during the low-ridership season in the first quarter of 2016) showed several trains running at 125% of seated capacity, even after the addition of a sixth car.  Capacity, or the lack of it, is becoming a problem and Caltrain will need to do more about it before 2020.

A montage of what a Caltrain EMU
by Stadler might look like,
based on a photo by Yevgeny Gromov
The recent award of electrification contracts, including an order for sixteen new six-car EMU trains from rail vehicle manufacturer Stadler, has brought this issue to the forefront.  Caltrain's Chief Operating Officer for Rail, Michelle Bouchard, had to concede in front of the Caltrain board of directors that the new EMUs would initially have a lower seat count than the diesel trains they will replace. The argument was that increased capacity could be achieved by increasing train frequency from 5 to 6 trains per peak hour per direction, and ultimately by lengthening the EMUs from 6 cars to 8 cars, something that can be done to an EMU without loss of performance or track capacity, unlike a diesel train.

Here are some thoughts about the capacity problem.

Capacity is measured in people, not seats.  Measuring passenger load factors as a percentage of seated capacity works well for airplanes, but doesn't quite do the trick for a transportation mode where passengers routinely stand.  The design of a train, including the number of seats, the interior layout, and accommodations for standees (handrails, poles, straps, etc.) has an enormous effect on the level of comfort experienced by passengers when the car operates at "125% seated capacity."  In rail vehicle A, filled with seats and with few places to stand, 125% feels uncomfortably crowded.  In rail vehicle B, with a lower seat count and large areas where passengers can comfortably stand, 125% of seated capacity feels just fine. A better metric of the true capacity of a rail vehicle is the number of seats plus some number of standees per unit of usable floor area (typically 4 standees per square meter); with such a metric, "100% capacity" feels like the same crowding regardless of train design.

Load factors over 100% seated capacity are desirable.  While this may be news to the person crushed between two sweaty people in the vestibule of a rush hour train, sizing the train fleet so that everyone can get a seat during the peak leads to a lot of empty seats running around the system or idling in yards during off-peak hours. This can be mitigated by changing the length of train consists (like BART), but unless trains are designed for this to begin with, it can't be done in daily practice.  Caltrain's new fleet of EMUs will not be easily reconfigurable unless two EMUs are coupled together; plans for this are not evident in the train configurations discussed in the EMU Request for Proposals (6 cars and 8 cars).  With fixed train consists, there is necessarily a sweet spot where a balance is achieved between two undesirable conditions: too many bums and not enough seats during the peak, and too many seats and not enough bums off-peak.  That sweet spot will mean peak load factors should very well be over 100% when measured as a fraction of seating capacity.

LIRR M-7 rail car with 5-abreast,
by Lexcie via Wikimedia Commons
Middle seats are seats, too.  The idea of 3+2 seating (five abreast) is usually batted away with a summary argument that passengers don't like middle seats, but it undeniably results in more seating capacity.  The question is, do passengers dislike middle seats more than they dislike standing? Commuter railroads on the East Coast seem to know the answer: the Long Island Rail Road M-7, the Metro North M-8, and the SEPTA Silverliner V, (to cite only the most modern examples) all feature 3+2 seating areas.  If providing seated capacity is so important, and if load factors are going to be measured as a percentage of seated capacity, then that middle seat is worth an easy 25% additional capacity.  The Caltrain EMU contract could be changed to require 3+2 seating; Stadler has already built a 3+2 bi-level EMU for a Russian client.

Fewer seats can actually increase passenger capacity.  If Caltrain stays with 2+2 seating and a lower seat count, the additional space for standees can provide greater passenger capacity if standees are properly accommodated.  The new EMUs should be configured with poles, handrails, grab handles or straps as necessary to allow standees to travel comfortably when no seats are available.  During the platform height transition period when Caltrain will be operating dual boarding heights (two sets of doors), the number of seats will temporarily drop after seats are removed from the high door boarding vestibules.  This may increase the load factor when measured as a percentage of seated capacity, but it will actually increase passenger capacity by opening up more room for standees.  Comfort may suffer, but only temporarily.

Caltrain should find a way to buy 8 car trains right away.  If some trains are already running at 125% seated capacity in 2016 during the winter low season, they are probably running at 150% seated capacity during the summer.  Seasonal load factor will go even higher if ridership continues to increase between now and 2020 when the new EMUs arrive.  By then, even with the entire Caltrain diesel fleet at six cars per train, the system will likely be bursting at the seams.  The step change in service quality thanks to the new EMU fleet will trigger another ridership increase.  Taking into consideration those three factors (high season peak, continued ridership escalation and better EMU service), it seems likely that six-car EMUs will be overcrowded from day one.  If Caltrain can scrape together another ~$150 million (another 7% of the total tab for modernization) to exercise an option on the Stadler contract, all EMUs can enter service in 2020 as 8-car trains.  Short platforms can be dealt with by prohibiting boarding and alighting from the front or rear cars at the few stations that cannot berth a 200-meter train.  An eight-car Stadler KISS with 2+2 seating will accommodate about 750 seated passengers and another 1000 standees.

27 October 2013

Census Driven Service Planning

The diagram at right shows where people live and work along the entire length of the rail corridor from San Francisco to Gilroy, as extracted from government census population and jobs data sets.  The diagram is also available as a PDF.

Implications for Rail Service Patterns

By simple observation of the features of the census population and job distributions along the peninsula corridor, it is possible to infer the desirable features of train service patterns that will maximize commute ridership.
  1. Transbay has more than 100,000 jobs within a half-mile radius (more than every other station in the system combined). The concentration of jobs near San Francisco's Transbay Transit Center cannot be understated. This station absolutely must be served by each and every train, and it would be highly counter-productive to terminate any train at 4th and King.
     
  2. Silicon Valley shows up in the jobs distribution as a broad hump, mostly homogeneous and stretching from Palo Alto to San Jose.  To serve this rich but diffuse commute market, all trains should make every stop in Santa Clara County.  There should never be any skip-stop service here, and the wider spacing of stops (relative to San Mateo County) will result in only minor trip time penalties.
     
  3. San Mateo County has numerous stops, spaced more closely together and with middling jobs and population density.  To enable faster service to and from San Francisco and Silicon Valley, it makes the most sense in this portion of the corridor to operate skip-stop express service alongside local service.
     
  4. South San Jose, while south of Silicon Valley, has a massive and untapped residential market that can serve as origin to jobs further north.  Tamien currently functions as a slow and infrequent addendum to the peninsula service, but should be sped up and extended to Blossom Hill.
     
  5. Oakdale in San Francisco opens up a new residential market for Caltrain.  The distribution of people nearby is even denser than at 22nd Street.
     
  6. The Gilroy extension doesn't make much sense.  There are so few jobs and people here that Caltrain (as primarily a commuter service) should not run to this area.  Serving Morgan Hill and Gilroy is best left for a long-distance operator such as Amtrak California.
Putting all this together, what would a service pattern look like that is tailored to the census distributions, to maximize commuter ridership?  First, it would not look like today's Baby Bullet, which severely under-serves numerous stops.  It would also look very different from Caltrain's latest planning fad, the "peak-period skip-stop zone express," used as the basis for all operational simulations in the blended service analyses published to date.  It would look like this, with distances drawn to scale:


  • The Silicon Valley express links the major employment centers of San Francisco and Silicon Valley, highlighted in orange, providing a faster and better alternative to fleets of white luxury buses stuck in traffic on US 101.  It would run every 15 minutes.
     
  • The San Mateo local serves all the minor stops throughout San Mateo County, terminating and originating across the platform from the Silicon Valley express at Redwood City.  This provides fast and penalty-free transfers between Silicon Valley and cities all along the peninsula.  The local turns back in Redwood City, minimizing crew and fleet requirements while still providing service every 30 minutes.
     
  • Stops in San Francisco and San Jose that have very large residential markets are served in the peak commute direction only.
This service pattern is also well-suited to future blended HSR service: a southbound high-speed train and a closely-following Silicon Valley Express can overtake and catch up (respectively) with a San Mateo local by using a four-track mid-line overtake facility constructed from San Mateo to Redwood City.  Because the local turns back at Redwood City, it does not impede traffic in Santa Clara County.

The time has come to fundamentally rethink peninsula rail service patterns.  Caltrain's "peak-period skip-stop zone express" is almost certainly not the best solution for meeting future demand; a much wider range of options must be considered.

02 June 2012

Is Demand-Based Planning a Myth?

Original photo by qviri
With over 80% of riders using Caltrain to commute to their jobs during rush hour, one would think that the service would be planned around where people live and where people work, using cold hard numbers from the census.  That's known as traditional demand-based planning: provide service where the most people will use it.  It's not rocket science, and demand-based planning is used all around the world to plan excellent rail service.

But not here on the peninsula.

In a contrarian argument made circa 2005, Caltrain's operations staff claimed that demand-based planning is a myth. (14 Mb PDF file)   At the time, Caltrain was crowing to its industry peers about the success of the Baby Bullet.  The keys to success included "Questioning Traditional Planning Processes" and "Trusting Your Intuition".  Numbers don't matter, just go with your gut!

In the years since, there has been plenty of hard evidence that the Baby Bullet has severely reduced ridership at many locations, especially in Santa Clara County.  Indeed, data from the 2010 census can be correlated to the latest Caltrain ridership data without ever looking at a timetable to reflect quite accurately which Caltrain stops are under-served and falling short of their ridership potential.

Maybe demand-based planning isn't such a myth after all.  Maybe numbers don't lie.  Here's hoping that objective, quantitative metrics will play a central role in planning future blended operation scenarios with high-speed rail.  This stuff is too important to trust anybody's intuition.

06 January 2012

Peninsula Rail Corridor Census

The U.S. Census Bureau provides an astonishing array of fine-grained statistics on population and jobs along the peninsula rail corridor.  When thinking about the future of peninsula rail service, and especially in deciding quantitatively how good a proposed timetable might be, or where stations should be placed, or how HSR should mesh with Caltrain in a 'blended' scenario, the basic consideration should be where people live and work.

Annual ridership counts provide one way of planning your timetable: simply add more service to the stops that get a lot of ridership.  This becomes a self-fulfilling prophecy with ridership patterns becoming distorted by the timetable, as observed with the Baby Bullet Effect.  Teasing apart the timetable-induced distortion from the underlying (and often untapped) ridership demand is impossible, so it is necessary to go back to the raw population and jobs data to build the full picture.  That is where the census really delivers.

Where People Live

Figure 1
The 2010 census provides the most recent snapshot of the population distribution on the peninsula, on a block-by-block basis that includes over 45,000 locations in the three Caltrain counties.  By tallying up how many people live within 1/4, 1/2, 1 and 2 miles of each Caltrain station location, you can build Figure 1.  This chart reveals where the population is densely concentrated around stations (e.g. San Mateo), or sprawled out (e.g. Sunnyvale).

Observations on the population numbers:
  • The new Oakdale station long proposed by San Francisco (with little support from Caltrain) could tap into more residential population than just about any other stop along the peninsula, or even 22nd Street.
  • The population density doesn't suddenly drop off at the southern end of the Caltrain-owned right of way in San Jose, where service suddenly drops off.  There are large concentrations of under-served population within a mile of the Tamien and Capitol stops, accounting for more than 3 times as many people as live within a mile of the San Jose Diridon station.
  • A stop like Broadway (Burlingame) with zero weekday rail service has more people living near it than Millbrae, site of the all-important BART intermodal station.  Other stations with poor Caltrain service (San Antonio, Cal Ave, San Bruno, Burlingame, Belmont, Santa Clara) have more people living nearby than stops with the best service, such as Palo Alto.
Figure 2
To assign to each station location a single weighting factor that quantifies that station's accessibility for nearby residents, regardless of distance, one can sum up each person divided by the square of how far away they live.  This inverse-square relationship is empirical, but captures the fact that people who live far away from a station are less likely to use it; its use in ridership modeling is not unprecedented.  A 1/r law would fall off too slowly, with the same number of people using the station from 1/2 mile away as 2 miles away (assuming constant population density).  A 1/r cubed law would fall off too quickly, with only 1/16th as many riders from 2 miles away as from 1/2 mile away.  As it turns out, the precise value of the exponent--if not exactly two--doesn't really drive the relative weights that strongly.  Only one small tweak has been applied to prevent people who live very close to a station from skewing the results: anyone living closer than 1/4 mile is considered 1/4 mile away.  The resulting inverse-square population weights for each station location are shown in Figure 2.
Where People Work

Figure 3
The Census Bureau publishes extensive statistics on local employment dynamics, providing block-by-block data on the number and distribution of jobs, pay levels, and industries.  The latest data set as of this writing is from 2009 (based on geographical data from the 2000 census covering over 32,000 locations in the three Caltrain counties).  The analysis presented here is based on raw data files, but the data can also be analyzed interactively using the Census Bureau's On The Map application.   Figure 3 shows how many jobs are located within 1/4, 1/2, 1 and 2 miles of each Caltrain station location.  Only the jobs worth more than $40k a year are shown, since lower-income jobs are less likely to require commuting (only about 15% of Caltrain riders earn less than $40k, and the average household income of a weekday peak Caltrain rider is over $100k).

Observations on the jobs numbers:
  • Not so surprisingly, there is a concentration of jobs in the vicinity of the future Transbay Transit Center, adjacent to the financial district.  What is more surprising is just how massive that concentration is: Transbay has more jobs within a half-mile radius (over 100,000) than all the other Caltrain stations combined, from 4th & King all the way down to Gilroy!
  • Job sprawl shows up in Santa Clara and southern Palo Alto (and most of Silicon Valley, really) in the form of few jobs near stations but many jobs within a mile or two.  Mountain View, despite its status as a major Baby Bullet stop, and home of Google, is not a particularly large job center.
Figure 4
Again, assigning to each station a weighting factor that quantifies that station's accessibility to nearby jobs, we apply the same inverse square relationship to obtain the job weights for each station location shown in Figure 4.  Note that Transbay goes way off the chart.
The Ridership Potential Matrix

Since 86% of riders during the weekday peak are commuters, the distribution of population and jobs can be used to construct a relative weight for the ridership that could potentially be generated between any given origin and destination (O&D) pair.  This is the ridership potential matrix.  The eventual purpose of this matrix is to help derive a single figure of merit for timetables, on an apples-to-apples basis, for how much of the potential ridership is tapped based on the service metrics for each O&D pair.  When considering any given timetable, this weighting scheme ensures that O&D pairs that have a lot of population and jobs at each end (such as 4th & King and Palo Alto) are given more importance compared to O&D pairs with lower population and fewer jobs (such as Atherton and Bayshore).

It is important to note that this ridership potential matrix is completely independent of how each O&D pair is connected by rail service; it holds true for any timetable.  It is solely a product of census data and the geographic location of each station.  A timetable must then be designed to unlock the maximum potential ridership.

The ridership potential matrix works like this: take for example station 1 and station 2, with respective population and job weights P1, P2, J1 and J2.  The weight for morning peak trips from origin 1 to destination 2 is P1*J2 (for people living near station 1 and working near station 2).  Conversely, the weight for morning peak trips from origin 2 to destination 1 is P2*J1 (for people living near station 2 and working near station 1).  When you multiply all the population weights from Figure 2 by all the job weights from Figure 4, you get a basic ridership potential matrix.  But there's a bit more to it than just people and jobs.

Distance Considerations

Regardless of where people live and work, there are upper and lower limits to how far they will typically commute by rail.  Extremely short trips are less likely because of the overhead of access and egress to and from the station, at each end of the journey.  Conversely, extremely long trips are less likely because of their sheer duration; regional commute patterns are not just a factor of train service considered in isolation, but also driving times.  That's why we will make the assumption that the distance distribution of commutes, generally speaking, is independent of the quality of train service--and that no foreseeable rail service pattern could significantly alter it.  Good service might lead to greater market share for rail, but the underlying distance distribution will be assumed not to budge.  This allows us to apply a (timetable-independent) distance distribution to the ridership potential matrix.

Figure 5
Caltrain ridership surveys show that the average trip length on the peninsula rail corridor during the weekday peak is about 25 miles.  The distance weighting function will be modeled as a Rayleigh distribution with a value of 0 at 0 miles and a peak of 1 at 25 miles-- for no particular statistical reason other than it ends up looking about right, as shown in Figure 5.

Each element of the ridership potential matrix is now the product of three factors: the distance weight based on the distance between origin and destination; the population weight at the origin station; and the job weight at the destination station.  This simple formulation yields the morning peak values shown in Figure 6 as a bubble graph (numerical values are available as a tab-delimited text file).  The evening peak is described by the transpose of the matrix, i.e. origin and destination switch places.  The distance-weighted ridership potential matrix is now ready for use in the quantitative analysis of past, present and future timetables, a topic that will be covered in upcoming posts revisiting the topic of service metrics.
Figure 6
Figure 8
Figure 7
In the meantime, we can explore other interesting aspects of the ridership potential matrix.  For example, summing the nth row together with the nth column of the matrix allows us to build a single weighting factor for the potential ridership at each stop including both the morning and evening peaks, i.e. a measure of the ridership distribution that could exist if it were tapped with excellent service, shown in Figure 7.  These weights can then be compared to the actual Caltrain ridership realized in 2011, yielding the scatter plot in Figure 8.  This comparison provides another more fundamental way (much better than historical ridership patterns) to visualize which groupings of Caltrain stops are under-served, and is amazingly accurate considering that it was constructed without ever looking at a timetable.

Key conclusions:
  • Access to Transbay would provide a step-change improvement in Caltrain service, with probable ridership gains of more than 25%.  Terminating any weekday peak train at 4th & King, as is inexplicably planned by Caltrain, is a huge mistake.  Agency turf battles with BART and the CHSRA regarding whether or how to pay for the downtown extension tunnel, and how to share platforms at Transbay, must be fought and won.
  • Underlying ridership demand is not accurately reflected by realized ridership, which suffers from severe timetable distortion.  Future service planning, and in particular the timetables assumed for the ongoing 'blended' operations analysis, must be based less on realized ridership and more on fresh census data--even if not using the simplified approach described here.
  • For the same reason that every Caltrain should serve Transbay (the huge concentration of jobs in San Francisco), HSR service that does not provide a one-seat ride into Transbay is a non-starter.

18 December 2011

The Baby Bullet Effect

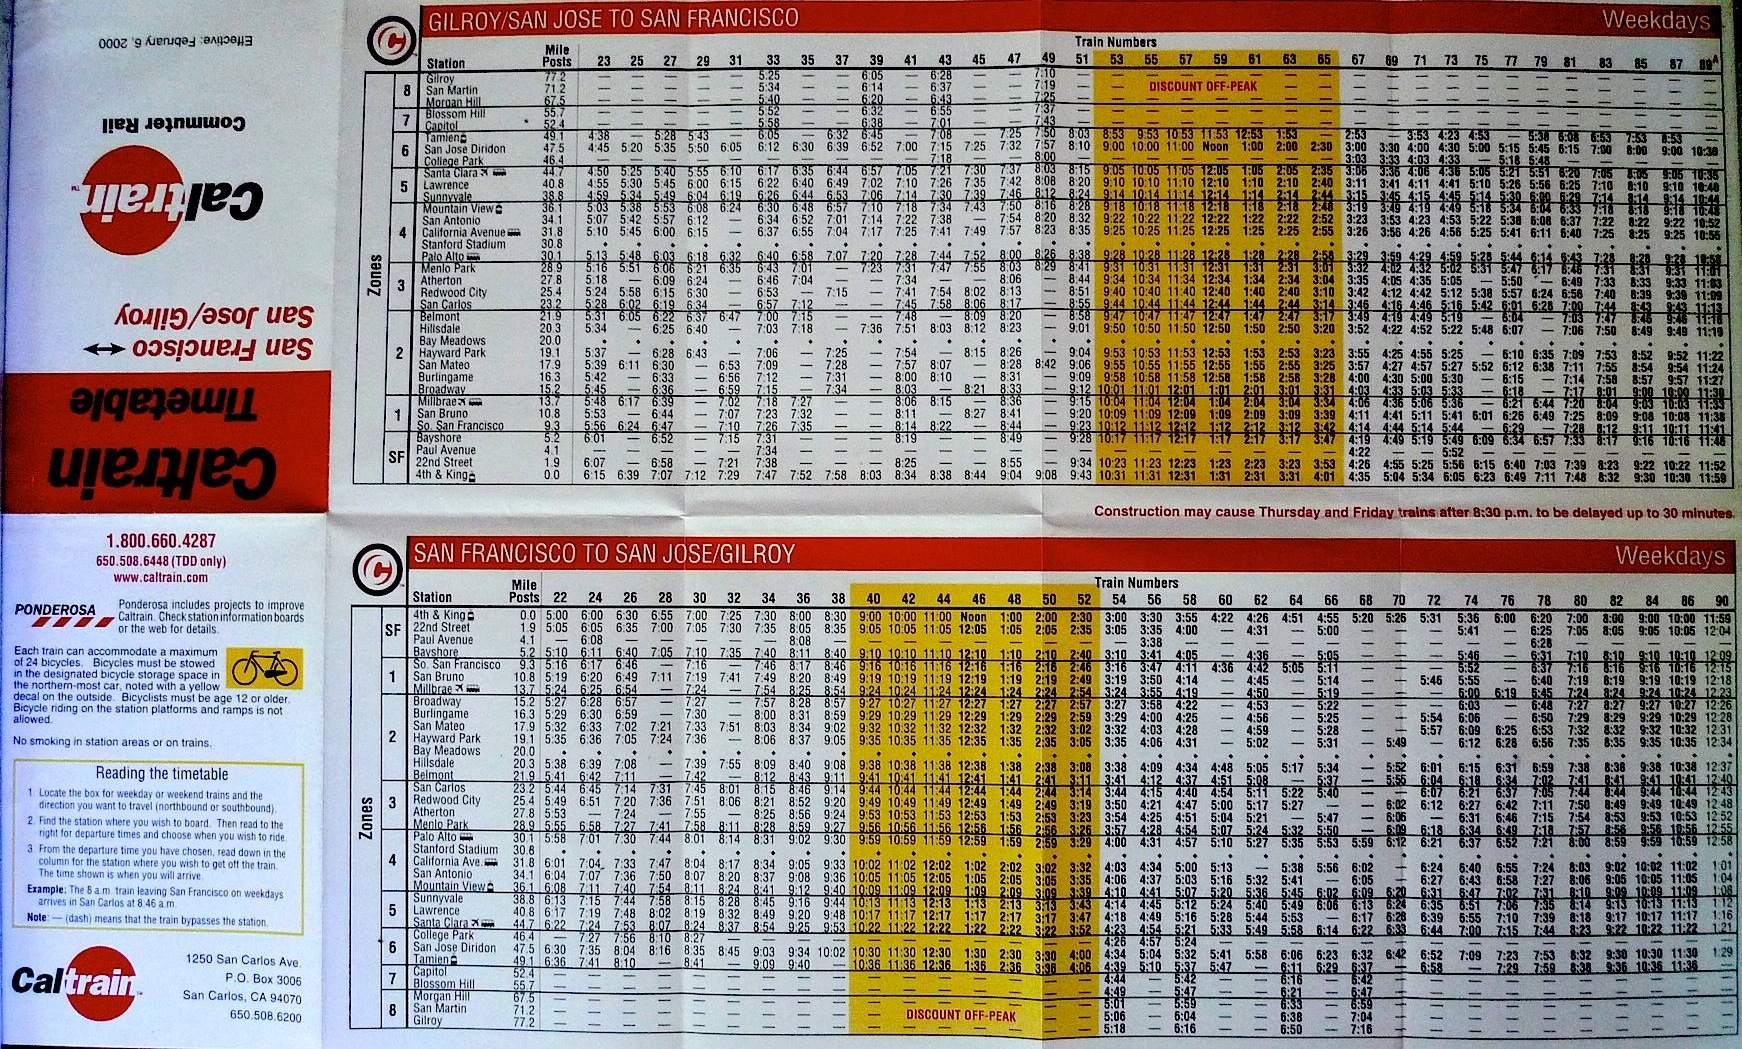
 For many years prior to 2004, including throughout the dot-com boom, Caltrain operated an all-stops a timetable with less stop-skipping (see February 2000 example) that fairly well revealed the underlying ridership demand at each station.  In 2004, that all changed with the advent of the Baby Bullet.  While the Bullet was a marketing triumph and remains a successful source of ridership and revenue, there was an under-reported flip-side to this new service: many small (and not-so-small) stations lost service.

Caltrain publishes annual ridership counts for each station, which can be distilled into a single table of historical counts of weekday boardings for each station reaching all the way back to 1992 (download 55kB Excel spreadsheet).  This data reveals interesting patterns.

The share of ridership at each station, which was fairly stable over several years leading up to the 2004 launch of the Baby Bullet, settled into a new pattern that has shown itself to be fairly stable in the years since 2004.  The change in each station's share is shown in the figure at right (also available as a 141kB PDF file), where 100% represents each station's average ridership share over the period 1999 - 2003, or the initial size of its slice of the ridership pie back in the pre-bullet days.  Following 2004, some slices got bigger, while other slices got smaller.  The entire pie also got a bit bigger, although that is not shown in this figure of the proportional trends for each station; ridership has only recently exceeded the 2001 peak.  The Baby Bullet Effect has divided stations into two groups: winners and losers.  Most of the losers were small and could justifiably be dispensed with.  Some were not, and are under-served to this day:
  • California Avenue in Palo Alto, 1376 weekday boardings in 2001, down to just 895 at last count
  • Lawrence in Santa Clara, 1309 weekday boardings in 2001, down to just 531 in 2011
  • Santa Clara, 1124 weekday boardings in 2001, down to just 656 in 2011
  • Burlingame, 985 weekday boardings in 2001, down to just 675 in 2011
  • Belmont, 892 weekday boardings in 2001, down to just 369 in 2011
  • San Bruno, 844 weekday boardings in 2001, down to just 403 in 2011
All of these places have more residents and jobs than implied by today's poor ridership, and are consistently under-served by Caltrain.

Planning for the Future

The future timetable plans revealed so far by Caltrain, including their notional electrification timetable and the timetables evaluated in the blended operations analysis, consist of an all-skip-stop service pattern as illustrated at left which "bakes in" the ridership pie slices as they exist today.  While the Baby Bullet is slated to be discontinued, its negative impact will live on at the places listed above, which will continue to be served by only two trains per hour (out of six).  Stakeholders at those stations should not allow this to happen.

As they plan their future operational concept, it is important that Caltrain base their stopping pattern on raw population and jobs data and not on the highly distorted ridership patterns induced by the Baby Bullet Effect.

06 October 2009

Ridership Math

With all the focus on high speed rail, it might be useful to review and recalibrate expectations regarding ridership on the peninsula rail corridor. Fire up your calculators: the conclusion may surprise you.

Caltrain Ridership Projections

According to a recent electrification update, Caltrain is now expecting 72029 weekday boardings by 2035, up from about 40000 today. That pencils out to an extremely conservative annual growth rate of about 2.3%; for comparison, ridership has grown at an annual rate of 8% over the last five years. The number of weekday trains is assumed to grow from 90 (formerly 98) to just 114.

Based on those unambitious projections, and assuming 35000 weekend boardings in 2035 (Saturday and Sunday, in similar proportion to today), the total annual ridership adds up to 20.0 million boardings. Turning back the clock from 2035 to 2030 using the average growth rate, we get 17.9 million annual boardings in 2030.

HSR Ridership Projections

The CHSRA's latest ridership projections were published as part of their 2008 Business Plan. The plan assumes (see page 5) that by the year 2030, a whopping 222 trains per weekday will serve San Francisco. The ridership is estimated based on two different fare levels, at 50% and 77% of air fares. Tallying all the regional ridership totals from the table on page 6 (reproduced at right) that include the Bay Area as origin and/or destination, the total year 2030 ridership is 28.6 million yearly boardings at 50% of air fare, falling to 20.2 million boardings at 77% of air fare.

Not all of these riders will go to peninsula destinations. Those starting or ending their trip in the Bay Area's most populous city, San Jose, should not be counted as peninsula corridor rail passengers. Suppose that 13% of trips that begin or end in the Bay Area do so at San Jose, a portion commensurate with San Jose's fraction of the total Bay Area population. That leaves the remaining 87% to travel for some distance along the peninsula, amounting to 25.5 million riders (at 50% of air fare), or 18.1 million riders (at 77% of air fare).

HSR will be operated to generate maximum yield, just like an airline striving to maximize the difference between revenue and cost, in order to help finance the expansion of the system. Since every ridership scenario shows that revenue increases with fares, even as ridership drops, we can reasonably eliminate the 50% of air fare scenario as a fantasy that no profit-seeking rail operator would ever consider.

So, using the CHSRA's own ridership figures at the 77% of air fare level, annual peninsula HSR ridership (counting only those riders whose trip includes the peninsula) comes to about 18 million.

Conclusion

The ridership estimates, when taken at face value, show that Caltrain and HSR will each have about 18 million annual riders by the year 2030 (as revealed by squinting at the figure at right). Factoring in the conservatism of Caltrain's assumptions and the optimism of the HSR assumptions, one can reasonably conclude:

Caltrain ridership is likely to outnumber HSR ridership on the peninsula for decades to come.

Who would have thought? And dare we hope this will be taken into consideration as the peninsula rail corridor is remodeled?

14 February 2009

Peninsula Rail Traffic: 2030

How much rail traffic can we expect on the peninsula by the year 2030? Both the California High Speed Rail Authority and Caltrain have projected ridership figures that allow us to estimate overall traffic levels on the peninsula corridor. Ridership figures are used to sell transportation projects to the public; more often than not, they are slightly overstated. Accordingly, consider the analysis below to be an upper bound.

Caltrain Capacity

Today, Caltrain runs 98 trains per weekday, with a peak rush hour capacity of 5 tph (trains per hour) per direction, or 6400 seats per peak hour, counting both directions. Off-peak capacity is 2 tph per direction, and weekend capacity is just 1 tph per direction.

Caltrain has about 37,000 boardings per weekday. At 98 trains/day x 640 seats/train, this figures to a 58% load factor (the average proportion of occupied seats) assuming all trips go the full length of the line. In practice, the average load factor is likely under 50%, although the most popular rush hour trains do approach 100% (i.e. standing room only).

Caltrain plans to grow its ridership, independently of high speed rail, by using electric rolling stock that can operate faster and more frequently. Their Caltrain 2025 plan calls for a peak capacity increase from 6400 seats/hour to 11000-16000 seats/hour by the year 2025. Assuming trains remain at the same seating capacity, this implies an increase in peak traffic from 5 tph to 9-12 tph per direction. Total capacity would roughly double, to about 200 trains per weekday.

Is this a reasonable estimate? It is useful to compare with BART's current traffic through the transbay tube. At peak times, BART runs about 20 tph in each direction, in 10-car trains that seat 700 and often carry crush loads of over 1000 people. Considering that BART serves a much greater geographical area than the peninsula, their 28000 seats/hour peak capacity in 2009 seems at least consistent with Caltrain's lower bound of 11000 seats/hour, achieved 15 years later. The verdict on Caltrain ridership projections: plausible (update: see comments section for a dissenting verdict: highly optimistic)

High Speed Rail Capacity

The California High Speed Rail Authority has published various ridership estimates over the years, the latest of which is contained in their 2008 business plan. The chapter on ridership and revenue estimates that by 2030, the peninsula corridor will see 8 - 10 tph per direction during six peak hours (6-9AM and 4-7PM) and about 6 tph per direction off-peak. That's a total of roughly 220 trains per weekday or 1300 trains per week.

Interestingly, there are no trains that skip San Jose or terminate at San Jose, which neatly sidesteps the rivalry between San Francisco and San Jose for the title of most important Bay Area destination.

If you assume the average HSR train seats about 400 people, that amounts to 27 million seats a year. That compares to 20 million seats a year currently offered by airlines between the Bay Area and the LA basin. (Southwest Airlines alone flies nearly 100 flights daily each way, although each one seats only about 130 people). Compared to airline traffic alone, the HSR figures sound optimistic, although most of the ridership is claimed to come from automobile traffic on the 5, 99 and 101 freeways, rather than airline traffic. Accounting for traffic growth between 2009 and 2030, which would double in that time span at an annual growth rate of just 3.5%, the verdict on HSR ridership projections is: plausible. (update: see comments section for a dissenting verdict: ludicrous)

Peninsula Traffic in 2030

Let's add it all up. Since peak hours for Caltrain and HSR will coincide with morning and evening rush hours, it is conceivable that peak traffic on the peninsula could reach 20 tph in each direction by the late 2020's (9-12 tph Caltrain and 8-10 tph HSR). Off-peak traffic would be closer to 10 tph in each direction (4 tph Caltrain and 6 tph HSR). Total weekday traffic would be about 420 trains (including both directions), an increase of four times over today's traffic levels over a span of two decades. To an observer at any given place along the peninsula corridor, there would be a train passing by on average every 1.5 minutes at rush hour, and every 3 minutes off-peak.

While the 20 tph figure is similar to that achieved by BART on two tracks, the peninsula corridor will be very different: it will support five different classes of service, each running at a different average speed.
  • HSR express, SF-SJ in 30 minutes (non-stop)
  • HSR limited, SF-SJ in 34 minutes (1 intermediate stop)
  • Caltrain Baby Bullet, SF-SJ in ~45 minutes (4 intermediate stops)
  • Caltrain limited, SF-SJ in ~55 minutes (10 intermediate stops)
  • Caltrain local, SF-SJ in ~66 minutes (15 intermediate stops)
Mixing these different classes of traffic requires frequent overtaking, which explains the requirement for four tracks throughout most of the peninsula corridor.

In San Francisco, there is a different implication to this 20 tph peak figure: since all trains must run at the same speed in the final approach to San Francisco, as dictated by the tight curve radii in this area, they would no longer need to overtake each other. Theoretically, running 20 tph through this speed-restricted area could be done on fewer than four tracks-- possibly just two! With homogeneous speeds, BART does it every day through the transbay tube, meshing together trains from four far-flung lines into a 20 tph trunk with just two tracks. Similarly, Amtrak and New Jersey Transit run up to 24 tph each way on the two tracks under the Hudson river. In both cases, there are efforts underway to increase the number of tracks, but it does give you a feel for the maximum throughput of two tracks when traffic is perfectly homogeneous.

Terminal Turnback Capacity

When a train reaches the end of the line in San Francisco, it needs to be cleaned, serviced and provisioned for its next trip. From arrival to departure, these operations typically take about an hour on other rail systems. If time is of the essence, which it will be in San Francisco, the turnback time might be reduced to about 30 minutes, very low by rail standards and commensurate with airline operations. The Transbay Transit Center is planned to have just six platform tracks shared by HSR and Caltrain, a very small number by international rail terminal standards. If a train occupies a platform track for just 30 minutes at a time, the maximum turnback capacity of a six-track terminal is 12 trains per hour.

This highlights another interesting feature of San Francisco rail operations: overall capacity into and out of the city will be constrained by terminal turnback capacity, and not by track capacity. You could build a six-track approach into San Francisco, but you still couldn't squeeze more trains in and out of the city.

Solutions to this Transbay turnback constraint include:
  • Turning some trains, most likely Caltrain services, at another station. The existing Caltrain terminal at 4th & King streets might be retained for this purpose.
  • Turning some HSR services at San Jose. This has the added benefit of reducing traffic on the peninsula.
Whatever happens between now and 2030, it is likely that the peninsula corridor will be hardly recognizable when compared to its current state.