06 January 2012

Peninsula Rail Corridor Census

The U.S. Census Bureau provides an astonishing array of fine-grained statistics on population and jobs along the peninsula rail corridor.  When thinking about the future of peninsula rail service, and especially in deciding quantitatively how good a proposed timetable might be, or where stations should be placed, or how HSR should mesh with Caltrain in a 'blended' scenario, the basic consideration should be where people live and work.

Annual ridership counts provide one way of planning your timetable: simply add more service to the stops that get a lot of ridership.  This becomes a self-fulfilling prophecy with ridership patterns becoming distorted by the timetable, as observed with the Baby Bullet Effect.  Teasing apart the timetable-induced distortion from the underlying (and often untapped) ridership demand is impossible, so it is necessary to go back to the raw population and jobs data to build the full picture.  That is where the census really delivers.

Where People Live

Figure 1
The 2010 census provides the most recent snapshot of the population distribution on the peninsula, on a block-by-block basis that includes over 45,000 locations in the three Caltrain counties.  By tallying up how many people live within 1/4, 1/2, 1 and 2 miles of each Caltrain station location, you can build Figure 1.  This chart reveals where the population is densely concentrated around stations (e.g. San Mateo), or sprawled out (e.g. Sunnyvale).

Observations on the population numbers:
  • The new Oakdale station long proposed by San Francisco (with little support from Caltrain) could tap into more residential population than just about any other stop along the peninsula, or even 22nd Street.
  • The population density doesn't suddenly drop off at the southern end of the Caltrain-owned right of way in San Jose, where service suddenly drops off.  There are large concentrations of under-served population within a mile of the Tamien and Capitol stops, accounting for more than 3 times as many people as live within a mile of the San Jose Diridon station.
  • A stop like Broadway (Burlingame) with zero weekday rail service has more people living near it than Millbrae, site of the all-important BART intermodal station.  Other stations with poor Caltrain service (San Antonio, Cal Ave, San Bruno, Burlingame, Belmont, Santa Clara) have more people living nearby than stops with the best service, such as Palo Alto.
Figure 2
To assign to each station location a single weighting factor that quantifies that station's accessibility for nearby residents, regardless of distance, one can sum up each person divided by the square of how far away they live.  This inverse-square relationship is empirical, but captures the fact that people who live far away from a station are less likely to use it; its use in ridership modeling is not unprecedented.  A 1/r law would fall off too slowly, with the same number of people using the station from 1/2 mile away as 2 miles away (assuming constant population density).  A 1/r cubed law would fall off too quickly, with only 1/16th as many riders from 2 miles away as from 1/2 mile away.  As it turns out, the precise value of the exponent--if not exactly two--doesn't really drive the relative weights that strongly.  Only one small tweak has been applied to prevent people who live very close to a station from skewing the results: anyone living closer than 1/4 mile is considered 1/4 mile away.  The resulting inverse-square population weights for each station location are shown in Figure 2.
Where People Work

Figure 3
The Census Bureau publishes extensive statistics on local employment dynamics, providing block-by-block data on the number and distribution of jobs, pay levels, and industries.  The latest data set as of this writing is from 2009 (based on geographical data from the 2000 census covering over 32,000 locations in the three Caltrain counties).  The analysis presented here is based on raw data files, but the data can also be analyzed interactively using the Census Bureau's On The Map application.   Figure 3 shows how many jobs are located within 1/4, 1/2, 1 and 2 miles of each Caltrain station location.  Only the jobs worth more than $40k a year are shown, since lower-income jobs are less likely to require commuting (only about 15% of Caltrain riders earn less than $40k, and the average household income of a weekday peak Caltrain rider is over $100k).

Observations on the jobs numbers:
  • Not so surprisingly, there is a concentration of jobs in the vicinity of the future Transbay Transit Center, adjacent to the financial district.  What is more surprising is just how massive that concentration is: Transbay has more jobs within a half-mile radius (over 100,000) than all the other Caltrain stations combined, from 4th & King all the way down to Gilroy!
  • Job sprawl shows up in Santa Clara and southern Palo Alto (and most of Silicon Valley, really) in the form of few jobs near stations but many jobs within a mile or two.  Mountain View, despite its status as a major Baby Bullet stop, and home of Google, is not a particularly large job center.
Figure 4
Again, assigning to each station a weighting factor that quantifies that station's accessibility to nearby jobs, we apply the same inverse square relationship to obtain the job weights for each station location shown in Figure 4.  Note that Transbay goes way off the chart.
The Ridership Potential Matrix

Since 86% of riders during the weekday peak are commuters, the distribution of population and jobs can be used to construct a relative weight for the ridership that could potentially be generated between any given origin and destination (O&D) pair.  This is the ridership potential matrix.  The eventual purpose of this matrix is to help derive a single figure of merit for timetables, on an apples-to-apples basis, for how much of the potential ridership is tapped based on the service metrics for each O&D pair.  When considering any given timetable, this weighting scheme ensures that O&D pairs that have a lot of population and jobs at each end (such as 4th & King and Palo Alto) are given more importance compared to O&D pairs with lower population and fewer jobs (such as Atherton and Bayshore).

It is important to note that this ridership potential matrix is completely independent of how each O&D pair is connected by rail service; it holds true for any timetable.  It is solely a product of census data and the geographic location of each station.  A timetable must then be designed to unlock the maximum potential ridership.

The ridership potential matrix works like this: take for example station 1 and station 2, with respective population and job weights P1, P2, J1 and J2.  The weight for morning peak trips from origin 1 to destination 2 is P1*J2 (for people living near station 1 and working near station 2).  Conversely, the weight for morning peak trips from origin 2 to destination 1 is P2*J1 (for people living near station 2 and working near station 1).  When you multiply all the population weights from Figure 2 by all the job weights from Figure 4, you get a basic ridership potential matrix.  But there's a bit more to it than just people and jobs.

Distance Considerations

Regardless of where people live and work, there are upper and lower limits to how far they will typically commute by rail.  Extremely short trips are less likely because of the overhead of access and egress to and from the station, at each end of the journey.  Conversely, extremely long trips are less likely because of their sheer duration; regional commute patterns are not just a factor of train service considered in isolation, but also driving times.  That's why we will make the assumption that the distance distribution of commutes, generally speaking, is independent of the quality of train service--and that no foreseeable rail service pattern could significantly alter it.  Good service might lead to greater market share for rail, but the underlying distance distribution will be assumed not to budge.  This allows us to apply a (timetable-independent) distance distribution to the ridership potential matrix.

Figure 5
Caltrain ridership surveys show that the average trip length on the peninsula rail corridor during the weekday peak is about 25 miles.  The distance weighting function will be modeled as a Rayleigh distribution with a value of 0 at 0 miles and a peak of 1 at 25 miles-- for no particular statistical reason other than it ends up looking about right, as shown in Figure 5.

Each element of the ridership potential matrix is now the product of three factors: the distance weight based on the distance between origin and destination; the population weight at the origin station; and the job weight at the destination station.  This simple formulation yields the morning peak values shown in Figure 6 as a bubble graph (numerical values are available as a tab-delimited text file).  The evening peak is described by the transpose of the matrix, i.e. origin and destination switch places.  The distance-weighted ridership potential matrix is now ready for use in the quantitative analysis of past, present and future timetables, a topic that will be covered in upcoming posts revisiting the topic of service metrics.
Figure 6
Figure 8
Figure 7
In the meantime, we can explore other interesting aspects of the ridership potential matrix.  For example, summing the nth row together with the nth column of the matrix allows us to build a single weighting factor for the potential ridership at each stop including both the morning and evening peaks, i.e. a measure of the ridership distribution that could exist if it were tapped with excellent service, shown in Figure 7.  These weights can then be compared to the actual Caltrain ridership realized in 2011, yielding the scatter plot in Figure 8.  This comparison provides another more fundamental way (much better than historical ridership patterns) to visualize which groupings of Caltrain stops are under-served, and is amazingly accurate considering that it was constructed without ever looking at a timetable.

Key conclusions:
  • Access to Transbay would provide a step-change improvement in Caltrain service, with probable ridership gains of more than 25%.  Terminating any weekday peak train at 4th & King, as is inexplicably planned by Caltrain, is a huge mistake.  Agency turf battles with BART and the CHSRA regarding whether or how to pay for the downtown extension tunnel, and how to share platforms at Transbay, must be fought and won.
  • Underlying ridership demand is not accurately reflected by realized ridership, which suffers from severe timetable distortion.  Future service planning, and in particular the timetables assumed for the ongoing 'blended' operations analysis, must be based less on realized ridership and more on fresh census data--even if not using the simplified approach described here.
  • For the same reason that every Caltrain should serve Transbay (the huge concentration of jobs in San Francisco), HSR service that does not provide a one-seat ride into Transbay is a non-starter.

18 December 2011

The Baby Bullet Effect

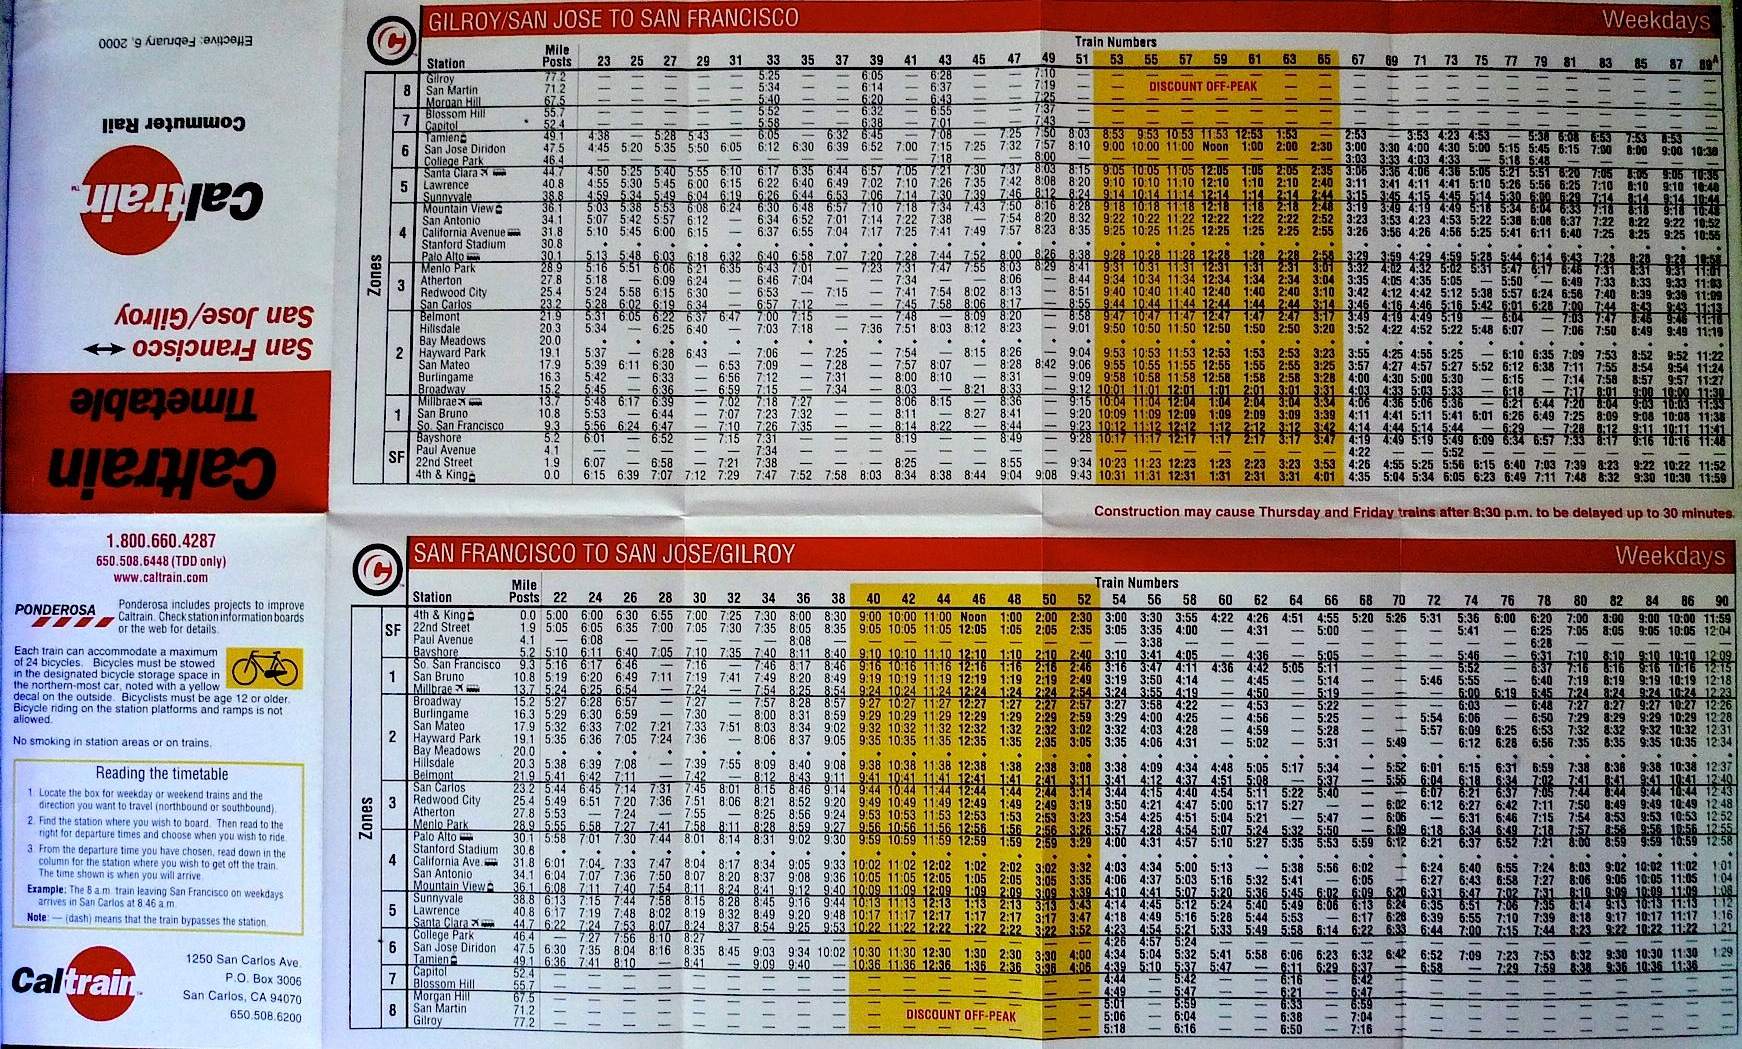
 For many years prior to 2004, including throughout the dot-com boom, Caltrain operated an all-stops a timetable with less stop-skipping (see February 2000 example) that fairly well revealed the underlying ridership demand at each station.  In 2004, that all changed with the advent of the Baby Bullet.  While the Bullet was a marketing triumph and remains a successful source of ridership and revenue, there was an under-reported flip-side to this new service: many small (and not-so-small) stations lost service.

Caltrain publishes annual ridership counts for each station, which can be distilled into a single table of historical counts of weekday boardings for each station reaching all the way back to 1992 (download 55kB Excel spreadsheet).  This data reveals interesting patterns.

The share of ridership at each station, which was fairly stable over several years leading up to the 2004 launch of the Baby Bullet, settled into a new pattern that has shown itself to be fairly stable in the years since 2004.  The change in each station's share is shown in the figure at right (also available as a 141kB PDF file), where 100% represents each station's average ridership share over the period 1999 - 2003, or the initial size of its slice of the ridership pie back in the pre-bullet days.  Following 2004, some slices got bigger, while other slices got smaller.  The entire pie also got a bit bigger, although that is not shown in this figure of the proportional trends for each station; ridership has only recently exceeded the 2001 peak.  The Baby Bullet Effect has divided stations into two groups: winners and losers.  Most of the losers were small and could justifiably be dispensed with.  Some were not, and are under-served to this day:
  • California Avenue in Palo Alto, 1376 weekday boardings in 2001, down to just 895 at last count
  • Lawrence in Santa Clara, 1309 weekday boardings in 2001, down to just 531 in 2011
  • Santa Clara, 1124 weekday boardings in 2001, down to just 656 in 2011
  • Burlingame, 985 weekday boardings in 2001, down to just 675 in 2011
  • Belmont, 892 weekday boardings in 2001, down to just 369 in 2011
  • San Bruno, 844 weekday boardings in 2001, down to just 403 in 2011
All of these places have more residents and jobs than implied by today's poor ridership, and are consistently under-served by Caltrain.

Planning for the Future

The future timetable plans revealed so far by Caltrain, including their notional electrification timetable and the timetables evaluated in the blended operations analysis, consist of an all-skip-stop service pattern as illustrated at left which "bakes in" the ridership pie slices as they exist today.  While the Baby Bullet is slated to be discontinued, its negative impact will live on at the places listed above, which will continue to be served by only two trains per hour (out of six).  Stakeholders at those stations should not allow this to happen.

As they plan their future operational concept, it is important that Caltrain base their stopping pattern on raw population and jobs data and not on the highly distorted ridership patterns induced by the Baby Bullet Effect.

06 December 2011

Holiday Required Reading

HSR Done Right

Sometimes, it's useful to look beyond the peninsula for context on what works best locally.  Here's a graphic from Richard Tolmach (in the latest TRAC Newsletter) that pretty much says everything that needs to be said about the California High Speed Rail Project.


As can be observed, the route that Tolmach and other organizations (including the plaintiffs in the Atherton lawsuits) have been advocating for years is very different from the route that the CHSRA is stubbornly advancing through the environmental clearance process.  In the Bay Area, the notable departure from the official plan is that HSR would branch off from the peninsula rail corridor at Redwood City, head over a new Dumbarton crossing, and zoom across Altamont Pass along the SETEC Alignment.

What does this have to do with anything peninsular?  Plenty, as it turns out.  Read on.

Caltrain's Blended Analysis

Caltrain recently published its analysis of the "blended" proposal, where Caltrain and HSR would share the peninsula rail corridor using less ambitious and expansive infrastructure than the four-track viaducts originally envisioned by the CHSRA.  This analysis concludes that it's feasible to run mixed Caltrain / HSR operations, although Caltrain service would be bunched up (with irregular skip-stop service patterns limited to six trains per hour) and HSR would need to slow down (about 40 minutes, rather than the planned 30 for SJ-SF) and be limited to 4 trains per hour.  On page 46, the document mentions that
The increased two-track shared use corridor distance from Whipple Avenue to San Jose Diridon, makes it very difficult for a 110 mph train to leave San Jose without encountering delay prior to reaching the overtake, and for a southbound HSR train to keep from being delayed by the Caltrain train it follows after the overtake.
Translation: sharing tracks should be done for the bare minimum distance, and certainly not 50 miles from SF to SJ.  Branching HSR off the corridor in Redwood City is a scenario that was NOT analyzed because it runs against Pacheco orthodoxy.  There is little doubt that it would make for an operationally superior solution (as computed by our free service pattern generator) with more Caltrain service, more Caltrain expresses, better transfer opportunities, easy-to-memorize clockface service patterns, and 125 mph HSR speeds... better in every way than the best scenarios LTK could come up with given the flawed assumptions of the study.

Speaking of better service planning...

The Swiss Take On California

Switzerland arguably has the most advanced, integrated and optimized rail service planning in the world.  The Swiss rail operations consultancy SMA+Partners supported a doctoral thesis analyzing the California rail network (including HSR) from an operations perspective.

Ulrich Leister's thesis (see executive summary) "applies a lean and rational approach to planning that is network and schedule-based.  A precise computer model is used to test different ideas such as infrastructure layouts or train types.  Gradually, the schedule is refined and optimized until the required rolling stock and the minimal amount of infrastructure needed to operate all the scheduled trains is determined."

This operations-first approach will likely come as a breath of fresh air to readers bewildered by our local experts' cost-maximizing ways.  A full copy of the thesis will be linked here as soon as it is made available.  Note in the network diagram at left that the Altamont route is identified as operationally superior, which will come as a surprise to CHSRA consultants who stubbornly insist Pacheco is the only way to go.

The Japanese Take On California

About a year ago, the East Japan Railway Company gave the CHSRA a peer review of their operations and maintenance approach.   Section 2.1.2.6 of this document addresses mixed service with other rail carriers.  It is reproduced in full below, with links added to relevant articles that echo the exact same points on this blog.
Based on JR East's experience of operating conventional train and Shinkansen train on the same track, following three aspects should be carefully considered.
First, the timetable should be carefully planned. The shared operation segment is likely to be the bottleneck of the high speed train timetable since delay in the conventional line will affect the entire high speed trains network. Therefore, if transport capacity is required, 'parallel' timetable (that is, High Speed Train and conventional train operate at the same speed) or increase the capacity of the commuter trains and reduce the frequency will be the solution. To establish a more flexible timetable, additional facilities will be required both in high speed train and the conventional lines. For example, siding tracks are required in stations in this segment, commuter train vehicles with good acceleration should be implemented, speed restrictions on curves should be reduced, more signals should be allocated, etc.
Second, rolling stock should be taken account. If the High Speed Train vehicle width is different from that of conventional trains, platforms must be trimmed, and/or boarding steps must be installed either on the high speed train or on the commuter train. These boarding steps may exceed the loading gauge at some areas, so they should be stowed away while the train is running. The difference in height of the doors of the rolling stock should also be taken into consideration. Finally, compatibility of Automatic Train Control system for high speed train and conventional train should be considered. Since the safety equipment is indispensable for either train, multiple safety equipments must be installed on the rolling stock, and radio communication system must also be shared. These must be switched at the border station. Preventing malfunction both on the wayside and on-board is also important.
All this good advice has clearly fallen on deaf ears.  For example, platform interface coordination is not even remotely on Caltrain's radar, and the HSR project is actively working against it.

18 November 2011

ERTMS Coming To California

The CHSRA recently added to its collection of technical memos a White Paper on train control technology for California's high-speed rail system.  The selected train control system will likely be deployed on the peninsula rail corridor later this decade or in the early 2020's, regardless of what "solution" Caltrain may pursue in the interim.  The CHSRA's experts looked far and wide for the best technical solution, and as longtime readers of this blog may have guessed, they conclude as follows:
The sole technology that is fully compliant with all of the CHSRA project and technical requirements is the European Rail Traffic Management System (ERTMS) European Train Control System (ETCS) Level 2 with Global System for Mobile Communications – Railway (GSM-R). ERTMS is service-proven and its attributes are highly applicable to CHSTP automatic train control (...)
The biggest technical obstacle for importing ERTMS to the U.S. is the lack of available radio frequency spectrum.  The White Paper delves into great detail about possible ways to overcome this, making several important policy statements along the way:
  • The choice of train control technologies will be limited to solutions that have been successfully demonstrated at high speeds for a period of at least 5 years, to minimize implementation risk and enable a strong safety case to be made to the FRA.
  • The CHSRA requires that it not be locked into a single source for procurement, bidding, and supply. Interoperable, interchangeable, open standard and multi-vendor solutions are required and will provide the CHSRA with several sources of supply for extensions, upgrades, and maintenance spare parts in the present and future, thereby lowering risk and cost. (Are you listening, Caltrain?)
  • Other alternatives to ERTMS are not technically compliant, not compliant with the project requirements, or present too much risk to implementation.
As it happens, the coveted ERTMS / ETCS Level 2 is transparently compatible with ERTMS / ETCS Level 1, which the White Paper describes as follows:
ETCS level 1 is designed as an add-on to or as an overlay on a conventional line already equipped with wayside signals, and possibly as a fallback solution from ETCS level 2. Communication from the track to the train is ensured by dedicated balises located on the trackside adjacent to the wayside signals at required intervals, and connected to the nearby interlocking and/or wayside signals.. The balises have a data connection to the ATC equipment which provides movement authorities for transfer to the train. Receiving the movement authority through balises, the ETCS onboard equipment automatically calculates and indicates to the train engineer maximum permitted speeds of the train and the next braking points if needed, taking into account the train braking characteristics and the track description data. This information is displayed to the train engineer through a dedicated screen in the cabin. The speed of the train is continuously supervised by the ETCS onboard equipment.
This is of course precisely the same thing as CBOSS, which Caltrain and their vendor Parsons Transportation Group are now kludging together for us for a hefty wheel-reinvention fee.

We've already seen Caltrain work with FRA bureaucrats to avoid re-inventing a double-deck EMU train.  Why can't they also work with CHSRA, FRA and FCC bureaucrats to avoid re-inventing a train control system?  The CHSRA is already putting together a plan for scaling the regulatory mountain, with more detail on radio frequency spectrum acquisition provided in TM 300.03 EMT Radio Frequency (RF) Spectrum Acquisition Strategy.

It's no longer just a blogger saying it (bloggers don't know what they're talking about): the high-speed rail project is now firmly on the record as preferring ERTMS as the sole solution, and is already working with government and private entities to obtain the necessary radio spectrum to deploy GSM-R in California.  ERTMS is the best solution for the peninsula, because it would allow high-speed trains to use Caltrain tracks with no special equipment or modifications.  As a side benefit, it would also allow Caltrain to meet their PTC requirement at minimal cost and risk.

ERTMS is coming.  Your move, Caltrain.

12 November 2011

Business Plan Impressions

The CHSRA's Draft 2012 Business Plan is out.  First impressions:

Sticker Shock.  In apples-to-apples 2010 dollars, the cost has soared from $4.7 billion (2008 Business Plan) to $5.4 billion (2009 Business Plan) to a jaw-dropping $13.6 billion (2012 Business Plan).  And that's just the start.  The $13.6 billion estimate is for Option A from the Alternatives Analysis, which is the all-viaduct-and-no-tunnel option.  Community demands for trenches and tunnels will only bid up the price from there.  Toss in the San Francisco DTX tunnel and convert to YOE dollars, and the cost goes right off the charts.  Amazingly, the business plan does not actually specify how the new peninsula costs break down.  The changes in each sub-total have to be backed out from available information, as shown below from 2009 to 2012:


Until Hell Freezes Over.  Under the phased implementation plan described in the Business Plan, the peninsula rail corridor might not get improved until the late 2020's, so any hope that Caltrain had to get HSR money for capital projects, blended or not, is pretty much on hold for a long, long time.  A solid plan B will be required for Caltrain, without relying on the HSR tooth fairy.

Three Things: Concrete, Concrete, and Concrete.  The most significant cost increases, on the peninsula and statewide, are due to a breathtaking increase in the scope of concrete-pouring.  The $13.6 billion peninsula figure includes $3.9 billion for viaducts, $3.1 billion for tunnels, about $2 billion for buildings and stations, and nearly a billion for earthwork and retaining walls (the dreaded berms).  Oh, and by the way, the business plan was prepared based on cost estimates from civil engineering firms, firms that get to define the scope of the project on which they may later bid.

Atherton Real Estate is Cheap.  The feared eminent domain battles for whatever corridor expansion might be planned barely show up in the bottom line, with a mere $830 million or six percent of the peninsula budget allocated to Right of Way acquisition.

The Astronomical Cost of Accommodating Caltrain.  While the current paradigm may be that HSR would operate in the Caltrain corridor, the business plan cost numbers (and especially the must-read cost increase numbers) suggest quite the opposite, with Caltrain cast in the role of the expensive interloper.  There are surprisingly high cost numbers built into the 2012 Business Plan to build over/under/next to Caltrain even while it continues operating.  For example:
  • $2.3 billion (2010$) of additional viaduct construction expenses, "associated with staged construction, loss of efficiency, and allowance for force account and premium pay - all to account for continuous support of rail operations in the corridor."
  • $1.9 billion (2010$) for a single-track tunnel to squeeze four tracks through Millbrae between neighborhoods, planned developments, and BART, in an area where "soils are very poor"-- a tunnel that would have no reason to be built without Caltrain.  The cost of this tunnel was previously decried at $0.5 billion, but this is something else entirely: the single-track tunnel, built in the same "very poor" soils as the triple-track Millbrae BART tunnel, would cost significantly more than the entire BART to SFO extension project.
  • $0.75 billion (2010$) to build a duplicate set of tunnels along the Bayshore Cutoff into San Francisco-- multiple tunnels that would have even less reason to be built without Caltrain.
You can see the planets slowly starting to line up: in due course, somebody, somewhere is bound to point out, in the upcoming "Value Engineering" phase, that a $5+ billion premium to keep Caltrain operating is far more expensive than simply extending BART down the peninsula from Millbrae to Santa Clara to ring the Bay.

That a peninsula BART extension would be suggested as a cost-saving measure is flabbergasting indeed, but this Business Plan fairly well guarantees it.